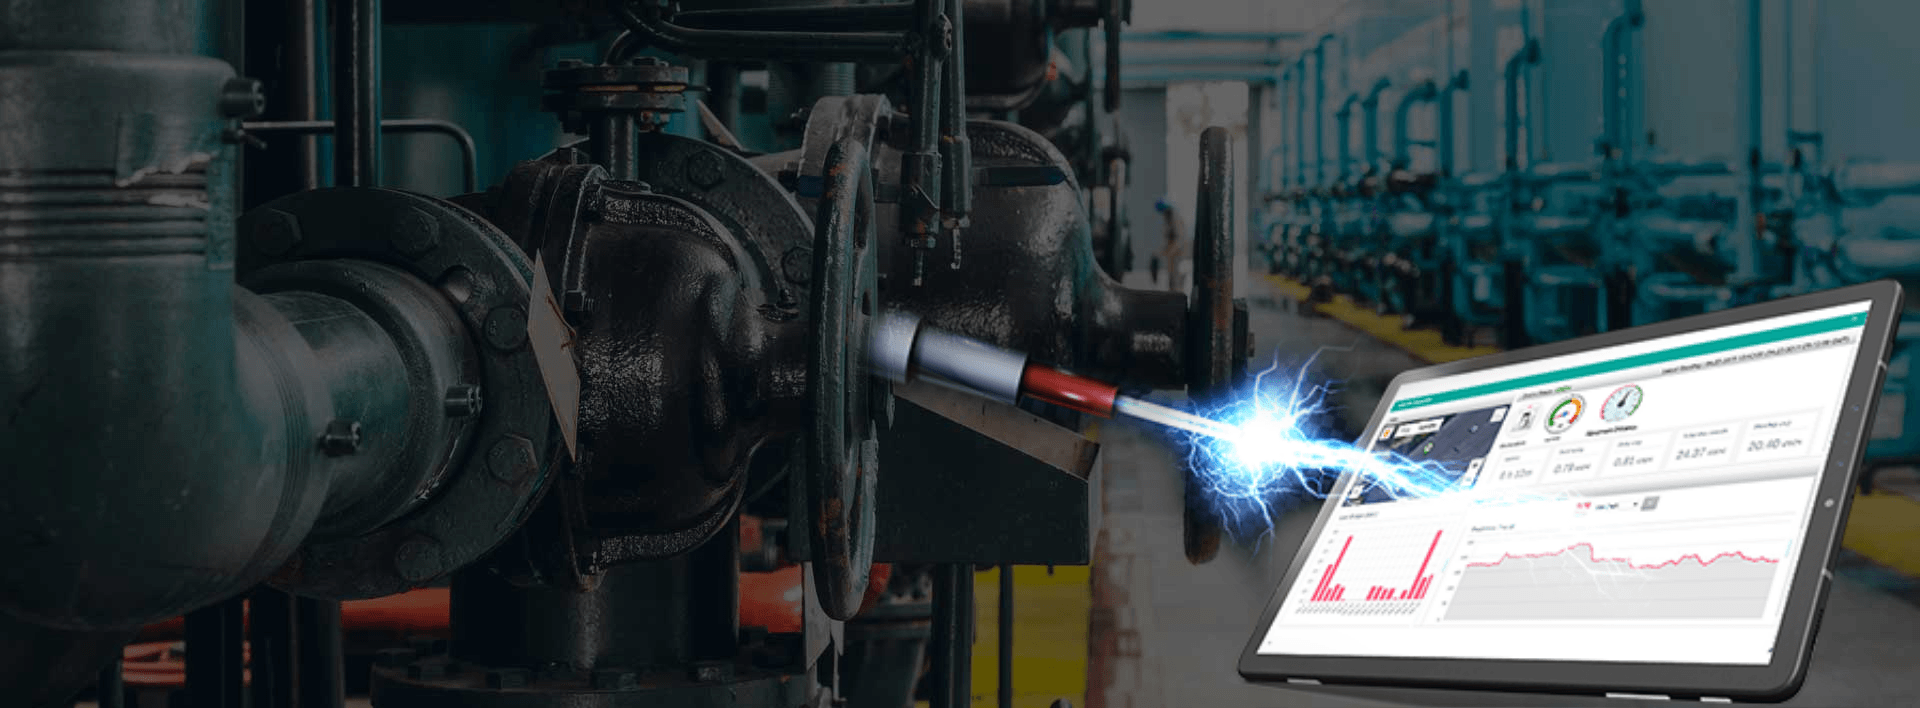
An Energy Management System (EMS) is the computer-driven energy control and monitoring system. It helps to efficiently monitor, analyze and control electrical equipment, electrical utility grids and optimize the performance of generation and transmission systems. It can also be helpful in small scale grids.
Energy Management System
Applications of Energy Management System

Equipment Availability Monitoring
With the help of historical trends, you will get aware of when and why your electrical equipment was not running. With the help of the energy management system, you will get real-time alerts about the machine shutdown or its availability. The information related to the machine can be viewed on an energy monitoring dashboard which has the option to be customized. Energy Management System can track the machine’s downtime with date and timestamp. It will surely empower the management to reduce unwanted and unexpected electrical equipment failure and schedule maintenance.
Facility Power Monitoring
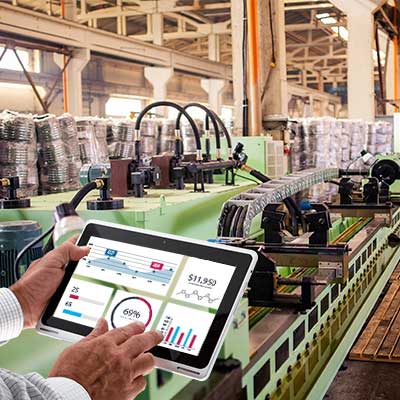
Techstar Energy Management System provides a simple way to retrieve and analyze power quality events. Unlike ancient energy management systems, the Techstar energy management system extracts the real-time energy consumption insights from your plant and provides you the machine uptime and power consumption data on your mobile/PC. The system additionally covers the facility generation and its utilization that makes it a one-stop answer.
Smart Grids
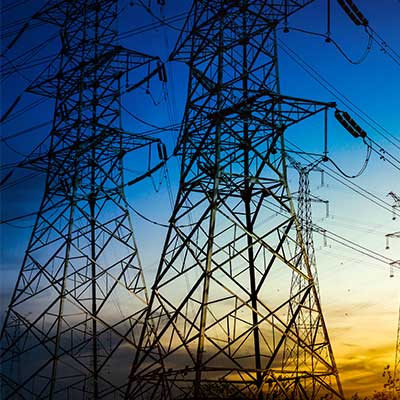
Techstar Energy Management System is additionally organized for smart Grids to produce distributed energy resources management system (DERMS) that delivers quick and reliable control. The two-way communication facilitates utilities to manage energy demand with efficiency, effectiveness, and responsibly. Also, have the capability to automate Demand Response (DR).
Benefits of Energy Management System
- Reduces Energy Consumption
- Detect Consumption Abnormality
- Optimize Cost
- Real-Time Energy Insights
- Operational Cost Reduction
- Boost-up Equipment Performance
- Increase Return of Investment (ROI)
- Future Energy Needs Prediction
- Electricity Demand Charge Reduction
- Track Energy Capabilities
- Trace Unnecessary Equipment Operations

Real-Time Energy Generation and Consumption Management System
Techstar IoT solution for energy monitoring offers complete visibility of energy consumption/generation into your industrial plant. it’ll assist you to get careful insights into your energy consumption not solely at the producing unit or building level however additionally at the level of the area, line, machine, and even individual product.
Energy Monitoring Dashboard
No matter you have different energy sources, with our unique energy monitoring dashboard, now the user can able to analyze and view the machine’s performance, its on-off time, Power consumption and all the important data which you think it would be beneficial. History graphs are easy to understand and visualize the complete performance of the machine or running equipment in industrial plants.

Energy Sources

Energy Consumption per Equipment
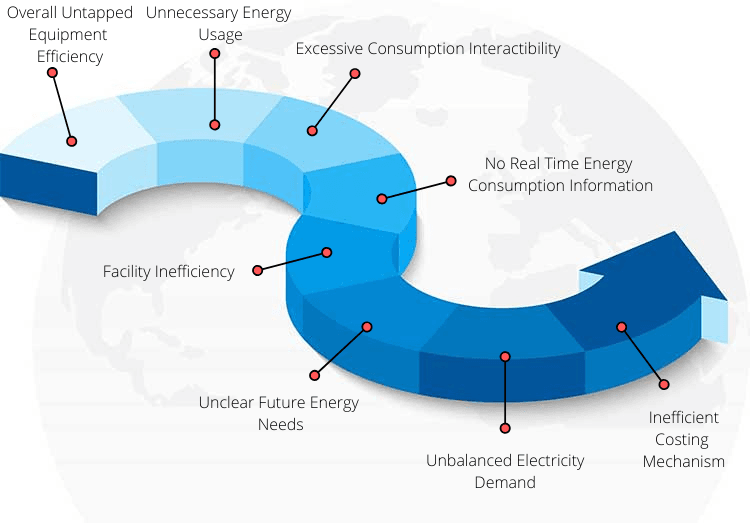
What Problems do Manufacturers Face?
What Measurements We Offer
Voltages
True RMS – each phase, line-to-line voltage and average.
Current
Each phase, average and neutral.
Active Power (P)
Each phase, total power.
Reactive Power (Q)
Each phase, total power.
Apparent Power (S)
Each phase, total power.
Power Factor
Each phase and total power factor.
Frequency
Actual frequency.
Load Nature
Inductive/Capacitive/Resistive.
Total Harmonic Distortion (THD) – upto 63rd Harmonics
Voltage THD of each phase, current THD of each phase.
Maximum Demand
Demand of Active (P), Reactive (S) and Apparent (S) power.
IOT for Energy Management System – Features
End-to-End IOT Solution
We choose the proper sensor for you, process the data to valuable information, and build the data accessible on Techstar IoT energy monitoring dashboard that is customized in keeping with your needs.
Real-time Monitoring and Control
Techstar IoT offers the real-time energy consumption information that helps you to endlessly monitor your equipment potency. which is able to assist you to decide if any machine is ought to get replaced.
Advanced Data Analytics
With Techstar IoT you’ll get an advanced Analytics feature that is able to assist you to identify energy consumption patterns, compare historical consumption, and predict future energy desires.
Equipment Efficiency Analysis
Techstar IoT empowers you to know when the equipment was active and when it wasn’t. you may be alerted if the equipment isn’t operating when it’s presupposed to active.
Consumption Patterns and Control Visualization
Techstar IoT provides information charts and visual image that helps you to grasp the data simply.
Centralized Dashboard
Techstar IoT provides all the data associated with installed devices (Machines) on one screen.
Customized and Interactive Reports
In just one click you will get detailed reports in different formats.
Two-way Communication
It is not simply the data intake from sensors, Techstar IoT also empowers you to control the energy supply additionally.
Real time Alerts
They have regular searches that stay active on a constant note. This makes it easier for users to observe errors instantly once they occur.
Frequently Asked Questions
Computation Boards and Software are one time cost depends on the number of sensing equipment. Since we install our data server to the client’s end so you can monitor the system both locally and offsite. Infact, no recurring payment schedule.
Yes absolutely, Techstar IOT supports multi level user login system which has the ability to show only allowed content.
Techstar IoT solution for the energy management system is extremely customizable. you’ll get a tailored dashboard, providing you alerts & notifications, data concerning all the installed devices with their current state and much more. With each deployment of this solution, we have a tendency to personalize the dashboard anytime.
The customize reports will be available in different formats like JPG, SVG, CSV and PDF. You can download which ever you want.
Yes, definitely you will get live data coming from different sources at your monitoring dashboard in terms of digital digits with history graphs and via pie chart.
All the information related to machine which is sensed by our computational boards will readily available on energy monitoring dashboard. And you can view from anywhere in the world.
